| ||||||||||||||||||||||||




What Is the Average Federal Individual Income Tax Rate on the Wealthiest Americans?
By Greg Leiserson, Senior Economist (CEA); and Danny Yagan, Chief Economist (OMB)★
最も裕福なアメリカ人に対する連邦個人所得税の平均税率はいくらですか?| ホワイトハウス
| ||||||||||||||||||||||||
最も裕福なアメリカ人に対する連邦個人所得税の平均税率はいくらですか?
シニアエコノミスト(CEA)のGregLeisersonによる。チーフエコノミスト(OMB)のダニーイェーガン
要約:私たちは、売れ残りの株からの収入を含む彼らの収入の比較的包括的な尺度を使用して、アメリカの最も裕福な400家族によって支払われる平均連邦個人所得税率を推定します。これは、IRS Statistics of Income Division、Survey of Consumer Finances、およびForbesマガジンから公開されている統計を使用して行います。私たちの一次分析では、2010年から2018年の期間の連邦個人所得税の平均税率は8.2%と推定しています。また、6〜12パーセントの範囲の推定値をもたらす感度分析も示します。大統領の提案は、低い推定税率の2つの主要な要因を緩和します。キャピタルゲインと配当所得に対する優遇税率と、ステップアップベースと呼ばれる規定を通じてキャピタルゲインに対する所得税の支払いを回避する裕福な家族の能力です。
アメリカ人が1ドルの賃金を稼ぐと、そのドルは通常の所得税率で即座に課税されます。[1]しかし、株の価値が上がったためにドルを稼いだ場合、そのドルは低い優先税率で課税されるか、まったく課税されません。[2]投資利益は裕福な人々の主な収入源であり、投資利益のこの優遇措置は最も裕福なアメリカ人にとって貴重な利益になります。しかし、最も一般的な税率の見積もりでは、所得の測定が不完全であるため、この税制上の優遇措置の価値を完全に把握することはできません。この分析では、次のように質問しています。より包括的な所得測定を使用して決定された、近年最も裕福な400人のアメリカ人家族が支払った連邦個人所得税の平均税率はどれくらいでしたか。
富裕層が低所得税をどのように享受するか:不完全な所得測定に対する優先税率
富裕層は、2つの主な理由から、毎年、低所得税率を支払っています。第一に、彼らの収入の多くは好ましい税率で課税されます。特に、配当や株式売却による所得は最大20%(純投資所得税を含めて23.8%)で課税され、他の所得に適用される通常の最大37%(40.8%)よりもはるかに低くなっています。
第二に、裕福な人々は、キャピタルゲイン収入が所得税申告書にいつ表示されるかを選択でき、それが表示されないようにすることさえできます。裕福な投資家が価値が上がった株を決して売らない場合、それらの資産がステップアップベースとして知られている規定の下で相続人に渡されるとき、それらの投資利益は所得税の目的で一掃されます。
収入のより包括的な尺度を分析する
株式売却収入(「実現キャピタルゲイン収入」)および配当からの優先税率は、一般的に引用される税率および当社の分析で顕著に表れています。
税率の既存の見積もりではあまり一般的ではない分析の重要な特徴は、非課税(「未実現」)のキャピタルゲイン収入が発生したときに、より包括的な収入測定に含めることです。[3]
ほとんどの家族は投資資産がほとんどないため、このより包括的な方法で収入を測定することは、ほとんどの家族の税率を見積もるのに比較的重要ではありません。[4]しかしながら、そのような未実現の、したがって非課税の利益が彼らの収入の大部分を占める最も裕福な家族にとって、それは非常に重要です。他のすべての形態の収入と同様に、未実現のキャピタルゲイン収入は、消費の資金調達に利用でき、経済的幸福を改善することができます。
経済学における収入を定義するための一般的な基準点は、Haig-Simons収入として知られています。[5]税引き前のHaig-Simonsの収入は、家族の富の変化に税金と消費を加えたものに等しくなります。私たちは、所得指標を家族の富の変化と簡単に見積もることができる税金と定義しています。私たちの収入の定義は、消費税やその他の税金を除外しているため、Haig-Simonsの定義よりも制限されていますが、キャピタルゲインのかなりの部分を収入に含める簡単な方法であり、公開されているデータを使用して実装できます。[6]
一次推定と感度
私たちの一次分析では、400の最も裕福な家族が、必要なデータが利用できる過去10年間からの数年間、2010年から2018年の期間に1.8兆ドルの所得に対して8.2%の平均連邦個人所得税率を支払ったと推定します。この低い推定税率に寄与する2つの要因には、課税されるキャピタルゲインと配当に対する低い税率と、課税所得から除外される投資利益に対する税金の支払いを恒久的に回避する裕福な家族の能力が含まれます。2022年の大統領予算は、キャピタルゲインと配当税率を引き上げ、最高所得のアメリカ人のステップアップベースを事実上終了し、それによってこれらの投資ゲインが所得税の対象となるようにすることを提案しています。
真の税率は、当社の主要な見積もりとは異なる場合があります。まず、所得の測定から消費と一部の税金を除外すると、8.2%の見積もりは、真に包括的な所得の測定と比較して、実際に測定された税率よりも高いことがわかります。第二に、私たちが依存しているデータと方法は不完全です。さまざまな推定の選択肢は、推定の感度を示しています。たとえば、主要な方法論的選択の1つ(以下の技術付録で詳細に説明)の基礎となる分析の仮定を変えると、推定値が6〜12パーセント変化します。
もちろん、私たちが見積もる税率は、政策の変更に敏感です。最高のキャピタルゲイン税率は、2003年5月から2012年までは15%で、2013年以降は20%(純投資所得税を含めて23.8%)です。さらに、連邦個人所得税は1つの税です。個人所得税に焦点を当てることで、その税の構造的限界と、富裕層が投資利益に対して段階的に税金を支払うことを回避する能力を削減するなどの改革の範囲が明らかになります。ただし、給与税、相続税、贈与税、法人所得税、外国政府に支払われる税金など、他の税金を考慮した代替税率も見積もることができます。さらに、収入の別の定義を使用するか、慈善寄付などの特定の助成活動の扱いにさまざまなアプローチを採用することができます。最後に、長期(2010〜 2018年)に焦点を当てます。これは、短期的な変動にもかかわらず、分析が正の資産収益の長期的な現実を反映していることを確認するのに役立ちます。ただし、異なる開始年と終了年を使用した代替の見積もり、および2009年のフォーブス400の資産を2008年から2010年の期間の平均に置き換える見積もりも提示します。
私たちの主要な推定値である8.2%は、一般的に引用されている連邦個人所得税の最高税率の推定値よりもはるかに低くなっています。たとえば、合同課税委員会(2021)は、所得別にランク付けされた家族の上位0.4%(つまり、所得が100万ドルを超える715,000世帯)の2021年連邦個人所得税率は26%になると見積もっています。私たちの分析は、(a)富によってランク付けされた少数の家族グループ(上位0.0002パーセント)を分析すること、および(b)未実現キャピタルゲイン収入を収入測定に含めることによって異なります。私たちの分析が一般的に引用されている推定値とどのように比較されるかについての追加の議論については、技術付録の終わりを参照してください。
方法
現在のデータの制限により、最も裕福な人々の税率の見積もりは不確実であり、改良の余地があることを強調します。
以下の技術付録で、この方法について詳しく説明します。我々はIRSトップ400・バイが支払った所得(SOI)部門の連邦個人所得税の統計取る:一言で言えば、私たちの方法は、以下のとおりである所得の消費者の財政の実態調査を使用して構築さ調整係数を乗じて、家族との(0.63)それを富の上位400人が支払う税金の見積もりに変換します。次に、フォーブス400の富の変化として、より包括的な所得の測定値に加えて、支払われた富の上位400の連邦個人所得税と州および地方の税控除の推定値(所得統計に基づいて同様に推定)を推定します。データ)。2つの比率により、推定税率が得られます。
結論
この分析では、公開されているデータを使用して、売れ残りの在庫からの収入を含む比較的包括的な収入の測定値を使用して、アメリカで最も裕福な400家族が支払う連邦個人所得税の平均税率を推定しました。一次分析では、2010年から2018年の期間の平均税率を8.2%と推定しました。また、6〜12パーセントの範囲の推定値をもたらす感度分析も示します。
優遇キャピタルゲイン率とステップアップベース(裕福な納税者が資産を相続人に渡すときに所得税の目的で未実現キャピタルゲインを一掃することを許可する税法の規定)は、この低い税率に貢献します。2022年の大統領予算は、キャピタルゲイン率を高め、最高所得のアメリカ人のステップアップベースを事実上終わらせ、それによって彼らの投資ゲインが所得税の対象となることを保証します。
技術付録
この技術付録では、IRSの所得統計(SOI)部門、連邦準備委員会の消費者金融調査(SCF)、およびForbes誌による最も裕福な400人のアメリカ人の推定値を組み合わせて、連邦個人所得税率を推定する方法について説明します。最も裕福な400家族によって支払われました。参考までに、フォーブスは、2018年に最も裕福な400人のアメリカ人が21億ドルから1600億ドルの範囲の富を持っていたと推定しています。私たちの税率の見積もりはドル加重です。これは、最も裕福な家族によって支払われた連邦個人所得税の合計の見積もりを、それらの家族の収入の見積もりで割ったものです。2010〜2018年の期間に焦点を当て、代替期間の見積もりも報告します。
まず、見積もり手順の基本的な考え方を説明し、次に詳細を説明します。400の最も裕福な家族によって支払われた連邦個人所得税の見積もりを、彼らの収入の比較的包括的な見積もりで割ります。分子については、まず、確定申告で報告された収入が最も多い家族が支払う税金を見積もることから始めます。次に、最も裕福な家族の収入が最も報告された収入の家族の収入とどのように比較されるかを推定し、それを調整係数として使用して、最も裕福な家族によって支払われる税金を推定します。分母については、フォーブス400の報告された富の変化を使用して、400の最も裕福な家族の収入を推定します。
分子:最も裕福な400家族によって支払われる推定連邦個人所得税
税率の見積もりの分子は、最も裕福な400家族が支払う2010〜2018年の見積もり税額に等しくなります。分子は、最も報告された所得の家族が支払う2010〜2018年の税金を推定し、消費者金融調査(SCF)に基づいて調整係数を掛けて、最も報告された所得の家族が最高の裕福な家族と同じではありません。
SOIは、1992年から2014年まで毎年400の最高報告所得世帯が支払う税金の見積もりを公開しました。最初の簡単なステップとして、このシリーズを2018年まで延長します。これを行うには、連邦個人の総所得の見積もりに依存します。 2001年から2018年まで毎年SOIから入手可能な上位0.001パーセントによって支払われる税金。両方の見積もりが利用可能な2001年から2014年の間、上位0.001パーセントによって支払われる税金に対する上位400によって支払われる税金の比率はでのみ変化します。 0.59前後の小さなウィンドウ。したがって、2015年から2018年の期間に400の高所得世帯が支払う税金は、この期間の上位0.001パーセントが支払う税金の0.59倍であると想定して見積もっています。
SOIに基づく、報告所得の最も高い400世帯が支払う2010〜2018年の税金の見積もりは、富裕層400世帯が支払う2010〜2018年の税金を確実に上回っています。最も裕福な家族の中には、報告所得が低く、税金の支払いが少ないものもあります。たとえば、ウォーレンバフェットは2015年のフォーブス400のメンバーでしたが、彼の自主的に発表された2015年の確定申告情報は、2015年の調整後総収入が1160万ドルであることを示しています(Cohen2016)。SOI推定における2015年の上位パーセンタイルグループのしきい値は、上位0.01パーセント(約14,000家族)に1190万ドルが必要であることを示しています。したがって、バフェットは、報告された収入でランク付けされた上位400の税単位は言うまでもなく、報告された収入でランク付けされた上位14,000の税単位にも含まれていませんでした。さらに、彼は2015年に連邦個人所得税で180万ドルを支払いました。これは、トップ0の平均3600万ドルをはるかに下回っています。001パーセントまたは上位0.01パーセントの平均900万ドル。その結果、報告された収入でランク付けされた上位400家族によって支払われた2015年の税金は、富によってランク付けされた上位400家族によって支払われた2015年の税金を過大評価することになります。
したがって、SOIに基づく、最も報告された所得の家族が支払う税金の見積もりを、最も裕福な家族が支払う税金の見積もりに変換する必要があります。これを行うには、SOIベースの推定値に0.63の調整係数を掛けます。これは、おおよその報告された収入と富の両方に関する情報を含む消費者金融調査から次のように作成されます。
式は、方法を明確にするのに役立ちます。TAX:税率の分子のための私たちの目標は、私たちのように書く400を通じて富ランク1で家族が支払った税金、推定することであるW 1400を。SOIデータは、私たちに400を介して報告された所得ランク1で家族が支払った税の推定値を与える:TAX I 1400。理想的には、TAX I 1,400に、400の最高所得世帯が支払う税金と400の最高報告所得世帯が支払う税金の比率に等しい調整係数(青色)を掛けます。
ただし、理想的な調整係数は、公開されているデータで直接測定することはできません。利用可能な最良のデータソースであるSCFは、支払われた税金に関する情報が不足しており、建設によって調査サンプルから最も裕福なForbes400を除外しています。401から1400にランク付けされた家族(つまり、報告された収入または富によってランク付けされた「次の1,000」グループ)の報告された収入を使用して理想的な調整係数を概算できるようにする2つの仮定を行います。 0.001パーセント。まず、報告所得が最も高いグループと富が最も高いグループが同じ平均税率を支払うと仮定します。[7] 次に、次の1,000グループの報告された収入の比率は、上位400グループの報告された収入の比率と同じであると想定します。これらの仮定の下で、理想的な調整係数を、次の1000の情報のみを使用する次の代替調整係数に置き換えることができます。
富によって次の千の報告収入を推定I W 401,1400することは比較的簡単です:SCF除外富によってトップ400は、我々は単にSCFで最も裕福な家庭の報告収入を使用するようにします。[8]
収入によって次の1000年の収入を推定I I 401,1400は、それが報告された収入によってフォーブス400とトップ400の間であり、どのくらいの重なりに依存して、より困難です。完全に重複している場合、報告された収入の上位400のいずれもSCFに含まれるべきではありません。私たちは、その後、推定可能性I I 401,1400を最高報告所得SCF観測を使用して、そうすることで、Saez and Zucman(2019)と同様に、0.44の調整係数が得られます。[9]もう一方の極端な例として、フォーブス400のいずれも収入で上位1400に含まれていない場合、使用する適切なSCF観測値は、報告された収入ランクが401から1400の観測値になります。そうすると、多くの高報告収入の家族が計算し、それによって0.66のより高い調整係数をもたらします。[10]調整係数が高いほど、結果として得られる税率の見積もりが高くなります。
スペクトルの保守的な側面に傾いています。100のオーバーラップを想定し、301から1300にランク付けされた家族を表すSCF観測の報告された収入を使用してI I 401,1400を推定します。そうすることで、0.63の調整係数が得られます。したがって、最も裕福な400家族が支払う税金の見積もりは、報告所得が最も高い400家族が支払うSOIベースの税金に0.63の調整係数を掛けたものに等しくなります。
分母:推定収入
最も裕福な400が支払う税金の見積もりを、最も裕福な400の収入のより包括的な見積もり、つまり、富の推定される変化と簡単に見積もることができる税金で割ります。この所得基準には、消費税やその他の税金が含まれていません。これにより、ヘイグサイモンの所得が過小評価され、ヘイグサイモンの所得に対する連邦個人所得税率が過大評価されます。
2010〜2018年の包括利益を見積もるには、まず、2018年のフォーブス400の総資産から2009年のフォーブス400の総資産(純資産)を差し引きます。[11]次に、Haigの2つのコンポーネントを追加します。 -税データで利用可能なサイモンの収入:支払われた連邦個人所得税(上記で推定)および州および地方の個人税控除(同じ0.63調整係数を使用して同じSOIデータから推定)。[12]
見積もりと感度
推定された分子と分母を使用すると、最も裕福な400人の2010〜2018年の連邦個人所得税率の主要な推定値は8.2%です。分子については、最も裕福な400世帯が連邦個人所得税で1,490億ドルを支払ったと推定されます。これは、SOIデータの最高所得世帯が支払った2,370億ドルに0.63を掛けたものに相当します。分母については、フォーブスの推定によると、最も裕福な400人が2010年から2018年の間に1.62兆ドルの富の変化を経験したことが示唆されています。推定1,490億ドルの連邦個人所得税と、同様に推定された460億ドルの州税および地方税を加えると、2010年から2018年の期間の最も裕福な400の所得は1.82兆ドルと推定されます。1,490億ドルを1.82兆ドルで割ると、8.2%になります。
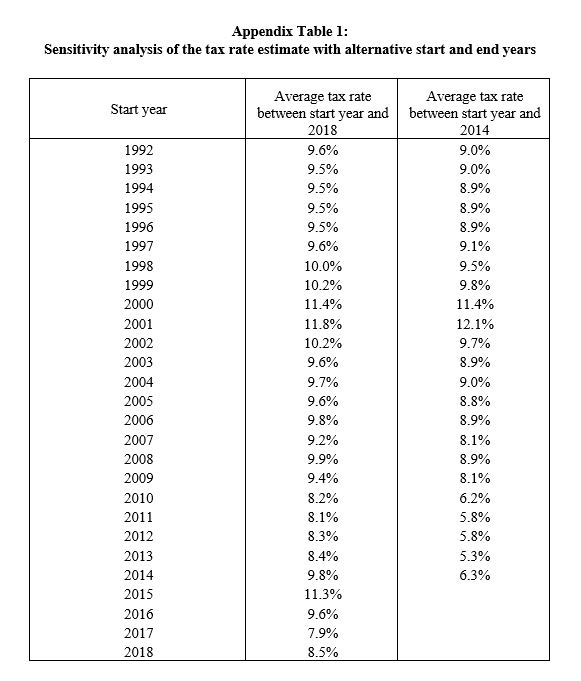
付録表1は、さまざまな期間の感度分析を示しています。列1は、2010年以外の年に始まり(すべて2018年に終わる)期間について、主な分析を繰り返します。2018年だけで8.5%、直近の5年間で9.8%、直近の20年間で10.2%の分析を行いました。列2は、2014年に終了する期間、この演習を繰り返します。これは、推定された上位400の連邦個人所得税データに依存しない最後の年です(ただし、2012年以降のキャピタルゲイン税率が高い年も含まれています)。 。2010〜2014年の分析では、6.2%が得られ、2014年だけで6.3%が得られます。さらに、2009年のフォーブス400の資産を2008年から2010年の平均に置き換えると、推定8.6%になります。
0.63の調整係数は誤差を伴って推定されています。推定の精度に対する最も重大なリスクの1つは、収入別の上位400に対する富別の上位400の収入が、次の1000の対応する比率と一貫して異なる場合です。その他の不確実性には、サンプリングまたは非サンプリングエラーが含まれます。私たちが依存しているSCFデータ。最高所得の家族が最高の富の家族であるという極端な仮定の下では、調整係数は1に等しく、2010〜2018年の平均税率は12.3パーセントになります。一方、Saez and Zucman(2019)の分析によると、最も裕福な家族の収入が最も高い家族の収入の43%しかない場合、平均税率は5.8%になります。
私たちは、すべての税金と消費を含む(税引前の)ヘイグ・サイモンズの収入よりも体系的に低くなるように、より包括的な収入の尺度を定義します。SOIデータには、含まれる可能性のある支出の1つの追加カテゴリに関する情報が含まれています。それは非営利組織への控除可能な寄付です。これらの控除可能な拠出金(州税および地方税の見積もりと同じ方法で見積もり)を包括利益に含めると、7.9%の見積もりが得られます。
フォーブス400の富は確かにエラーで測定されます。活発な文献は、富の分布の最上部で富の測定を研究および評価しています(例:Kennickell 2009; Johnson、Raub、and Newcomb 2013; Piketty 2014; Kopczuk 2015)。Saez and Zucman(2016)は、資本化された所得税申告書を使用して、フォーブスを主に与えられたとおりにしながら、SCFよりもトップウェルスの成長が速いと推定しています。進行中の作業では、Smith、Zidar、およびZwick(2020)は上位400の見積もりを公開していませんが、一般的に上位の富の成長が遅いと見積もっています。これは、フォーブスが誤解されている、取引されていない資産を評価できない、または贈り物を観察できない、または借金。トップウェルスの成長率が高いと税率が低くなり、トップウェルスの成長率が低いと税率が高くなります。例えば、
3つのクロスセクションデータソース間でデータを組み合わせると、調査期間に一貫性がなくなります。私たちのターゲット人口は、年末の富に基づいて調査された期間の各年で最も裕福です。フォーブス400のデータは毎年秋にリリースされます。0.63の調整係数は、t + 1年のある時点で調査したときに富でランク付けされた家族と比較して、t年の収入でランク付けされた家族に基づいています(ただし、報告された富は調査時点で最新である場合とそうでない場合があります)。 。最も裕福な家族は時間とともに変化するため、フォーブス400の合計を年間で差し引くと、毎年の終わりに最も裕福な家族の収入が過小評価され、税率が過大評価されます。[13]
私たちの税率の見積もりは、議会予算局、税務合同委員会、財務省、および税務政策センターによって作成された、一般的に引用されている連邦個人所得税の最高税率よりも大幅に低くなっています。[14]これらの見積もりは、3つの重要な点で私たちの見積もりとは異なります。第一に、そして最も基本的に、議会予算局、税務合同委員会、財務省、および税務政策センターは、未実現キャピタルゲインを大部分除外する所得指標に関連する税率を推定します。したがって、分析では、さまざまな程度で、この分析の動機となる非課税所得が除外され、より正確に見積もられた現金所得フローが優先されるため、私たちよりも大幅に高い税率が見つかります。第二に、税制優遇の実現キャピタルゲインは、これらの他の見積もりが作成されたより大きなトップグループよりもトップ400の収入の大きなシェアです。第三に、所得税率を所得ではなく富で調べると、未実現キャピタルゲインは高所得世帯よりも高所得世帯にさらに集中する可能性があります。
見積もりの根本的な不確実性を強調することにより、この技術付録を締めくくります。私たちの分析が、未実現キャピタルゲイン所得を含む所得税率のさらなる推定と直接測定を、富のグループごとに刺激することを願っています。
参考文献
Bricker、J.、P。Hansen、およびAHVolz。2019.「消費者金融調査の上限を引き上げた後の米国の富の集中」。経済学の手紙184。(リンク)
コーエン、パトリシア。2016.「バフェットはトランプのブラフを呼び出し、彼の税データをリリースします。」ニューヨークタイムズ、10月10日。(リンク)
議会予算局。2021年。「世帯収入の分布、2018年。」(リンク)
ジョンソン、B.、B。ラウブ、およびJ.ニューコム。「アメリカの最も裕福な子孫のための収入と富の関係の新しい見方。」SOIワーキングペーパー。ワシントン:収入の内国歳入庁統計。(リンク)
課税に関する合同委員会。2012.「分配分析における課税に関する合同委員会のスタッフが使用する所得の定義の概要」。JCX-15-12。(リンク)
課税に関する合同委員会。2021年。「2021年に有効な連邦税制の概要」。JCX-18-21。(リンク)
Kennickell、AB 2009.「池と小川:米国の富と収入、1989年から2007年。」金融と経済のディスカッションシリーズ2009-13。ワシントン:連邦準備制度理事会。(リンク)
Kopczuk、W。2015.「米国のトップウェルスシェアの進化について私たちは何を知っていますか?」Journal of Economic Perspectives 29、no。1:47-66。(リンク)
ピケティ、T. 2014年。21世紀の資本。ケンブリッジ:ハーバード大学出版局。
Saez。E.とG.ズックマン。2016.「1913年以降の米国の富の不平等:資本化された所得税データからの証拠」。経済学の季刊誌131、いいえ。2:519-578。(リンク)
Saez、E。およびG. Zucman 2019.「プログレッシブ富裕税」。経済活動会議草案に関するブルッキングスの論文。(リンク)
Smith、M.、O。Zidar、およびE.Zwick。2020年。「アメリカのトップウェルス:金持ちに課税するための新しい見積もりと含意。」ワーキングペーパー、プリンストンエコノミクス。(リンク)
税務政策センター。2021年。「T21-0134–平均実効連邦税率–すべての税単位、拡張された現金所得所得パーセンタイルによる、2021年。」(リンク)
米国財務省税務分析局。2020年。「分配表:2021 001; 2021年の現行法に基づく家族、現金収入、および連邦税の分配。」(リンク)
[1]賃金の稼ぎ手は、退職貯蓄口座に寄付することにより、法定の制限に従い、課税を延期することができます。その他の一般的に適用される税制上の優遇措置も、労働者の税率を引き下げる可能性があります。
[2]原資産を取得してから1年以内に実現される少数のキャピタルゲインは、通常の税率で課税されます。
[3]未実現キャピタルゲインは、資産が売却される前であっても資産の価値が増加することです。1億ドル相当の企業株を購入し、その後10年間で2億ドルに値上がりする裕福な個人は、その期間に1億ドルの未実現キャピタルゲイン収入を獲得しました。これらの未実現のキャピタルゲインは、最も裕福なアメリカ人の主要な収入源です。
[4]たとえば、連邦準備制度の分配金融口座は、2021年の第1四半期の時点で、富による家族の上位1%が企業株と投資信託の価値の54%を保有していたのに対し、50は11%であったと推定しています。番目-90番目パーセンタイル、及びボトム50%を1%未満。
[5]たとえば、課税に関する合同委員会(2012)は、「経済学者は、理論的には、ヘイグ・サイモンの収入の尺度が経済的幸福の最良の尺度であることに一般的に同意している」と述べています。
[6]このアプローチは、中産階級の家族が収入のはるかに大きな割合を消費するため、情報量が少なくなります。
[7]最も裕福な家族が支払う平均税率に関する直接的な証拠はありません。原則として、平均税率はどちらの方向にも異なる可能性があります。最高所得の家族は、低税率で課税される1年間の大規模なキャピタルゲインの実現により高所得であるため、より低い平均税率を支払う可能性があります。あるいは、最も裕福な家族は、多額の慈善控除のために、納税申告所得のより低い割合を税金で支払う可能性があります。
[8]消費者金融調査は、プライバシーの懸念から、フォーブス400に含まれるすべての人をサンプルから意図的に除外しています。ただし、一部のForbes 400の資産は、Survey of Consumer Financesサンプルに含まれる家族によって表される場合があり、一部の追加の観測値もSCFサンプルから除外されます。Bricker、Hansen、およびVolz(2019)は、二重カウントなしでForbes400データを使用してSCFを拡張する方法を提案しています。2つの間に鋭いカットオフがあり、集計を計算するために消費者金融の調査に依存しないと仮定することにより、単純化します。
[9]ただし、完全なオーバーラップの仮定は、上位400の望ましい比率が1になることを意味することに注意してください。事実上、この一連の仮定の下では、次の1000の値は、上位400の値への不十分なガイドになります。このセクションで説明する手順を実装する際に、2001〜 2019年のSCFを使用し、結果の年間調整を平均します。有効なサンプルサイズを増やすために、何年にもわたる要因。
[10]技術的には、SCFはサンプルの重みを使用した調査であるため、重みを付けたときにこれらのランクを表す観測値を意味します。関連するランク境界を越えるSCF観測値を分割し、観測値の重みの比例した割合を境界の両側に割り当てます。
[11]フォーブス400が富を推定する日付は、時間とともに変化しました。2020年、フォーブスは7月末近くに市場価格を使用しました。2019年、フォーブスは9月の市場価格を使用しました。簡単にするために、フォーブス400を年末の富の見積もりとして扱います。フォーブスのリストは、個人レベルの情報と近親者の情報を組み合わせたものです。これを家族レベル(より正確には税単位レベル)の情報として扱うことにより、この影響は小さいと予想されますが、収入の見積もりはある程度保守的になる可能性があります。
[12] 2015年から2018年の期間の上位400の州および地方税控除は、2014年の上位0.001パーセントの州および地方税控除の上位400のシェアに、2015年の上位0.001パーセントの合計控除を掛けたものとして帰属します。 –2018。2017年の税法は、州および地方税の控除を制限していました。2018年についてのみ、2018年の上位0.001%の連邦税に、2014年から2017年の上位0.001%の連邦税の合計に対する州および地方の税控除の合計の比率を掛けることにより、上位0.001%の税単位の州および地方の税控除の合計を計算します。 。
[13]発生する可能性のあるさらなるタイミングの問題は、富裕層が富によってトップ400に入っていない場合にのみキャピタルゲインを体系的に実現するかどうかです。この場合、毎年の富による上位400の税率は、非常に裕福な人々の税率のライフサイクル推定を過小評価する可能性があります。しかし、これが懸念される場合、非常に裕福な人々の税率の見積もりがそれによって影響を受けるかどうかは明らかではありません。非常に裕福な人々が富でトップ400に入っているときに体系的に彼らの収入を実現しない場合、私たちの調整係数は彼らの課税所得を過大評価している可能性があります。
[14]議会予算局(2021)は最近、2014年から2018年までの期間の世帯の最高所得1%の平均連邦個人所得税率が約24%であると推定しました。他のアナリストは主に将来の予測に焦点を当てています。財務省(2020)は、2021年の家族の最高所得0.1%の連邦個人所得税の平均税率は23%であると推定し、税務政策センター(2021)は25%であると推定しました。課税に関する合同委員会(2021)は、収入が100万ドル以上の家族の税率は26%になると見積もっています。2017年税法は、2018年に個人所得税率を引き下げました。ただし、
★
Abstract: We estimate the average Federal individual income tax rate paid by America's 400 wealthiest families, using a relatively comprehensive measure of their income that includes income from unsold stock. We do so using publicly available statistics from the IRS Statistics of Income Division, the Survey of Consumer Finances, and Forbes magazine. In our primary analysis, we estimate an average Federal individual income tax rate of 8.2 percent for the period 2010-2018. We also present sensitivity analyses that yield estimates in the 6-12 percent range. The President's proposals mitigate two key contributors to the low estimated rate: preferential tax rates on capital gains and dividend income, and wealthy families' ability to avoid paying income tax on capital gains through a provision known as stepped-up basis.
When an American earns a dollar of wages, that dollar is taxed immediately at ordinary income tax rates.[1] But when they gain a dollar because their stocks increase in value, that dollar is taxed at a low preferred rate, or never at all.[2] Investment gains are a primary source of income for the wealthy, making this preferential treatment of investment gains a valuable benefit for the wealthiest Americans. Yet the most common estimates of tax rates do not fully capture the value of this tax benefit because they use an incomplete measure of income. This analysis asks: what was the average Federal individual income tax rate paid by the 400 wealthiest American families' in recent years, determined using a more comprehensive measure of income?
How the wealthy enjoy low income tax: preferred rates on an incomplete measure of income
The wealthy pay low income tax rates, year after year, for two primary reasons. First, much of their income is taxed at preferred rates. In particular, income from dividends and from stock sales is taxed at a maximum of 20 percent (23.8 percent including the net investment income tax), which is much lower than the maximum 37 percent (40.8 percent) ordinary rate that applies to other income.
Second, the wealthy can choose when their capital gains income appears on their income tax returns and even prevent it from ever appearing. If a wealthy investor never sells stock that has increased in value, those investment gains are wiped out for income tax purposes when those assets are passed on to their heirs under a provision known as stepped-up basis.
Analyzing a more comprehensive measure of income
Preferred tax rates on income from stock sales ("realized capital gains income") and from dividends feature prominently in commonly cited tax rates as well as in our analysis.
An important feature of our analysis that is less common in existing estimates of tax rates is that we include untaxed ("unrealized") capital gains income in our more comprehensive income measure as they accrue.[3]
Measuring income in this more comprehensive manner matters relatively little for estimating most families' tax rates, as most families have few investment assets.[4] However, it matters greatly for the wealthiest families for whom such unrealized and thus untaxed gains are a large share of their income. Like all other forms of income, unrealized capital gains income can be tapped to finance consumption and can improve financial wellbeing.
A common reference point for defining income in economics is known as Haig-Simons income.[5] Pre-tax Haig-Simons income equals families' change in wealth, plus taxes and consumption. We define our income measure as families' change in wealth plus easily estimable taxes. Our definition of income is more limited than the Haig-Simons definition because it excludes consumption and other taxes, but it is a simpler way to include a substantial share of capital gains in income and can be implemented with publicly available data.[6]
Primary estimate and sensitivity
In our primary analysis, we estimate that the 400 wealthiest families paid an average Federal individual income tax rate of 8.2 percent on $1.8 trillion of income over the period 2010–2018, the years from the last decade for which the necessary data are available. Two factors that contribute to this low estimated tax rate include low tax rates on the capital gains and dividends that are taxed, and wealthy families' ability to permanently avoid paying tax on investment gains that are excluded from taxable income. The 2022 President's Budget proposes to raise the capital gains and dividend tax rate and to virtually end stepped-up basis for the highest-income Americans, thereby ensuring these investment gains are subject to income tax.
The true tax rate of interest may differ from our primary estimate. First, excluding consumption and some taxes from our measure of income suggests that the 8.2 percent estimate is actually higher than the tax rate measured relative to a truly comprehensive measure of income. Second, the data and methods on which we rely are imperfect. Different estimation choices illustrate the estimate's sensitivity. For example, varying the analytic assumptions underlying one of our key methodological choices (discussed in greater detail in the technical appendix below) causes the estimate to vary from 6 to 12 percent.
The tax rate we estimate is, of course, sensitive to changes in policy. The top capital gains tax rate was 15 percent between May 2003 and 2012 and has been 20 percent (23.8 percent including the net investment income tax) since 2013. In addition, the Federal individual income tax is only one tax. Focusing on the individual income tax sheds light on the structural limitations of that tax and the scope for reforms, such as curtailing the ability of the wealthy to avoid paying tax on their investment gains through stepped-up basis. However, alternative tax rates could also be estimated that account for other taxes, such as the payroll tax, estate and gift tax, corporate income tax, and taxes paid to foreign governments. Moreover, one could use alternative definitions of income or adopt various approaches to the treatment of certain subsidized activities such as charitable giving. Finally, we focus on an extended time period (2010–2018), which helps to ensure that our analysis reflects the long-run reality of positive asset incomes despite short-run fluctuations. However, we also present alternative estimates using different start and end years, as well as an estimate that replaces the Forbes 400 wealth in 2009 with the average for the period 2008–2010.
Our primary estimate of 8.2 percent is much lower than commonly cited estimates of top Federal individual income tax rates. For example, the Joint Committee on Taxation (2021) estimates that the 2021 Federal individual income tax rate on the top 0.4 percent of families ranked by income (i.e., the 715,000 families with income over $1 million) will be 26 percent. Our analysis differs by (a) analyzing a smaller group of families (the top 0.0002 percent) ranked by wealth, and (b) including unrealized capital gains income in the income measure. See the end of the technical appendix for additional discussion of how our analysis compares to commonly cited estimates.
Method
We emphasize that any estimate of tax rates on the wealthiest is uncertain and open to refinement, due to current data limitations.
We detail our method in the technical appendix below. In a nutshell, our method is as follows: we take the IRS Statistics of Income (SOI) Division's Federal individual income taxes paid by the top-400-by-income families and multiply it by an adjustment factor constructed using the Survey of Consumer Finances (0.63) to convert it to an estimate of taxes paid by the top-400-by-wealth. We then estimate a more comprehensive measure of income as the change in Forbes 400 wealth, plus our estimates of the top-400-by-wealth's Federal individual income taxes paid and State-and-local tax deductions (estimated similarly based on Statistics of Income data). The ratio of the two yields our estimated tax rate.
Conclusion
In this analysis, we used publicly available data to estimate the average Federal individual income tax rate paid by America's wealthiest 400 families, using a relatively comprehensive measure of their income that includes income from unsold stock. In our primary analysis, we estimated an average tax rate of 8.2 percent for the period 2010–2018. We also present sensitivity analyses that yield estimates in the 6–12 percent range.
Preferential capital gains rates and stepped-up basis—a provision of tax law that allows wealthy taxpayers to wipe out unrealized capital gains for income tax purposes when they pass assets to their heirs—contribute to this low tax rate. The 2022 President's Budget would increase capital gains rates and virtually end stepped-up basis for the highest-income Americans, thereby ensuring their investment gains are subject to income tax.
Technical Appendix
This technical appendix documents how we combine publicly available data from the IRS Statistics of Income (SOI) Division, the Federal Reserve Board's Survey of Consumer Finances (SCF), and Forbes magazine's estimates of the wealthiest 400 Americans to estimate the Federal individual income tax rate paid by the wealthiest 400 families. For reference, Forbes estimates that the 400 wealthiest Americans in 2018 had wealth ranging from $2.1 billion to $160 billion. Our tax rate estimate is dollar-weighted: it is an estimate of total Federal individual income taxes paid by the wealthiest families, divided by an estimate of those families' income. We focus on the period 2010–2018 and report estimates for alternative periods as well.
We first describe the basic idea of the estimation procedure and then go through the details. We divide an estimate of the Federal individual income taxes paid by the 400 wealthiest families by a relatively comprehensive estimate of their income. For the numerator, we start by estimating the taxes paid by the families with the highest reported income on tax returns. Then we estimate how the income of the highest-wealth families compares to the income of the highest-reported-income families and use that as an adjustment factor to estimate the taxes paid by the highest-wealth families. For the denominator, we use changes in the reported wealth of the Forbes 400 to estimate the income of the 400 wealthiest families.
Numerator: estimated Federal individual income taxes paid by the wealthiest 400 families
The numerator of our tax rate estimate equals estimated 2010–2018 taxes paid by the wealthiest 400 families. We construct the numerator by estimating the 2010–2018 taxes paid by the highest-reported-income families, then multiply by an adjustment factor based on the Survey of Consumer Finances (SCF) to account for the fact that highest-reported-income families are not the same as the highest-wealth families.
SOI published estimates of the taxes paid by the 400 highest-reported-income families annually from 1992 through 2014. In a first and straightforward step, we extend this series through 2018. To do this, we rely on estimates of the total Federal individual income tax paid by the top 0.001 percent, available from SOI annually from 2001 through 2018. For the years 2001 through 2014, when both estimates are available, the ratio of taxes paid by the top 400 to taxes paid by the top 0.001 percent varies in only a small window around 0.59. We therefore estimate the taxes paid by the 400 highest-income families for the period 2015 through 2018 by assuming that it is 0.59 times the taxes paid by the top 0.001 percent for this period. Our SOI-based estimate of 2010–2018 taxes paid by the 400 highest-reported-income families equals actual SOI top-400 taxes for years 2010-2014, plus our estimates for years 2015–2018.
Our SOI-based estimate of 2010–2018 taxes paid by the 400 highest-reported-income families surely exceeds the 2010–2018 taxes paid by the 400 highest-wealth families: some of the wealthiest families have lower reported income and pay less tax. For example, Warren Buffett was a member of the 2015 Forbes 400, but his voluntarily-released 2015 tax return information indicates 2015 adjusted gross income of $11.6 million (Cohen 2016). The thresholds for top percentile groups in 2015 in the SOI estimates show that $11.9 million was required to be in the top 0.01 percent (about 14,000 families). Thus, Buffett was not even in the top 14,000 tax units ranked by reported income, let alone the top 400 ranked by reported income. Moreover, he paid $1.8 million in Federal individual income tax in 2015, far less than the $36 million average for the top 0.001 percent or the $9 million average for the top 0.01 percent. As a result, the 2015 taxes paid by the top 400 families ranked by reported income would overstate the 2015 taxes paid by the top 400 families ranked by wealth.
Hence, we must convert our SOI-based estimate of taxes paid by the highest-reported-income families into an estimate of taxes paid by the highest-wealth families. We do so by multiplying the SOI-based estimate by an adjustment factor of 0.63, constructed as follows from the Survey of Consumer Finances which contains information both on approximate reported income and on wealth.
A formula helps to clarify the method. Our goal for the numerator of the tax rate is to estimate taxes paid by the families with wealth rank 1 through 400, which we write as: TAXW1,400. The SOI data give us an estimate of the taxes paid by the families with reported-income rank 1 through 400: TAXI1,400. Ideally, we would multiply TAXI1,400 by an adjustment factor (in blue) equal to the ratio of the tax paid by the 400 highest-wealth families to the tax paid by the 400 highest-reported-income families:
However, the ideal adjustment factor cannot be directly measured in publicly available data. The best available data source—the SCF—lacks information on taxes paid and excludes the Forbes 400 wealthiest from the survey sample by construction. We make two assumptions that allow one to approximate the ideal adjustment factor using reported incomes among families ranked 401 through 1400 (i.e., the "next-1,000" groups ranked either by reported income or by wealth), which is approximately the rest of the top 0.001 percent. First, we assume that the highest-reported-income and highest-wealth groups pay the same average tax rate.[7] Second, we assume that the ratio of the reported incomes for the next-1,000 groups is the same as the ratio of reported incomes for the top-400 groups. Under those assumptions, one can replace the ideal adjustment factor with the following alternative adjustment factor that uses only next-1000 information:
Estimating the reported income of the next 1,000 by wealth IW401,1400 is relatively straightforward: the SCF excludes the top 400 by wealth, so we simply use the reported income of the wealthiest families in the SCF.[8]
Estimating the income of the next 1000 by income II401,1400 is more challenging, as it depends on how much overlap there is between the Forbes 400 and the top 400 by reported income. If there is full overlap, then none of the top 400 by reported income should be in the SCF. We could then estimate II401,1400 using the SCF observations with the highest reported incomes; doing so would yield an adjustment factor of 0.44, similar to Saez and Zucman (2019).[9] At the other extreme, if none of the Forbes 400 is in the top 1400 by income, then the appropriate SCF observations to use would be those with reported income ranks 401 through 1400. Doing so would exclude many high-reported-income families from the calculation and thereby yield a higher adjustment factor of 0.66.[10] A higher adjustment factor leads to a higher resulting tax rate estimate.
We lean toward the conservative side of the spectrum: we assume an overlap of 100 and estimate II401,1400 using the reported income of the SCF observations that represent families ranked 301 through 1300. Doing so, we obtain an adjustment factor of 0.63. Thus, our estimate of taxes paid by the wealthiest 400 families equals the SOI-based taxes paid by the 400 highest-reported-income families multiplied by our 0.63 adjustment factor.
Denominator: estimated income
We divide our estimate of taxes paid by the wealthiest 400 by our more comprehensive estimate of the wealthiest 400's income: their estimated change in wealth, plus easily estimable taxes. This income measure excludes consumption and other taxes, which would cause us to understate Haig-Simons income and therefore overstate the Federal individual income tax rate on Haig-Simons income.
To estimate comprehensive income for the 2010–2018 period, we begin by subtracting the total wealth (net worth) of the Forbes 400 in 2009 from the total wealth of the Forbes 400 in 2018.[11] We then add two additional components of Haig-Simons income that are available in tax data: Federal individual income taxes paid (estimated above) and State and local individual tax deductions (estimated from the same SOI data using the same 0.63 adjustment factor).[12]
Estimate and sensitivity
Using our estimated numerator and denominator, our primary estimate for the 2010–2018 Federal individual income tax rate for the wealthiest 400 is 8.2 percent. For the numerator, we estimate that the wealthiest 400 families paid $149 billion in Federal individual income taxes, equal to the $237 billion paid by the highest-income families in the SOI data multiplied by 0.63. For the denominator, Forbes estimates suggest that the wealthiest 400 experienced a change in wealth for the period 2010–2018 of $1.62 trillion. Adding the $149 billion of estimated Federal individual income taxes and an analogously estimated $46 billion in State and local taxes, we estimate the wealthiest 400's income for the period 2010–2018 to be $1.82 trillion. Dividing $149 billion by $1.82 trillion, we obtain 8.2 percent.
Appendix Table 1 presents a sensitivity analysis for different periods. Column 1 repeats our main analysis for time periods that begin in years other than 2010 (all ending in 2018). Our analysis for 2018 alone yields 8.5 percent, for the most recent five years yields 9.8 percent, and for the most recent 20 years yields 10.2 percent. Column 2 repeats the exercise for time periods that end in 2014, which is the last year that does not rely on extrapolated top-400 Federal individual income tax data (though it also includes fewer years with the higher post-2012 capital gains tax rates). Our analysis for years 2010–2014 yields 6.2 percent and for 2014 alone yields 6.3 percent. In addition, replacing 2009 Forbes 400 wealth with its 2008–2010 average yields an estimate of 8.6 percent.
Our 0.63 adjustment factor is estimated with error. One of the most substantial risks to the accuracy of the estimate is if the income of the top 400 by wealth relative to the top 400 by income differs consistently from the corresponding ratio for the next 1000. Other uncertainties include sampling or non-sampling error in the SCF data on which we rely. Under the extreme assumption that the highest income families are the highest wealth families, the adjustment factor would equal 1, and the average tax rate for 2010-2018 would be 12.3 percent. If, on the other hand, the highest wealth families have only 43 percent of the income of the highest-income families following Saez and Zucman's (2019) analysis, the average tax rate would be 5.8 percent. If the highest wealth families systematically differ from the next 1000 for whom information is available in the SCF, the ratio could, in principle, be even lower.
We define our more comprehensive measure of income such that it is systematically lower than (pre-tax) Haig-Simons income, which includes all taxes and consumption. The SOI data contain information on one additional category of expenditure that could be included: deductible contributions to nonprofit organizations. When including these deductible contributions (estimated in the same way as we estimate State and local taxes) in comprehensive income, we obtain an estimate of 7.9 percent.
Forbes 400 wealth is surely measured with error. An active literature studies and assesses wealth measurement at the very top of the wealth distribution (e.g., Kennickell 2009; Johnson, Raub, and Newcomb 2013; Piketty 2014; Kopczuk 2015). Saez and Zucman (2016) use capitalized income tax returns to, over some periods, estimate faster growth in top wealth than does the SCF while mostly taking Forbes as given. In ongoing work, Smith, Zidar, and Zwick (2020) do not publish top 400 estimates, but generally estimate slower growth in top wealth, which could be consistent with Forbes being misled, unable to value nontraded assets, or unable to observe gifts or debt. Higher growth in top wealth would lead to lower tax rates while lower growth in top wealth would lead to higher tax rates. For example, if the Forbes 400 overstates top wealth growth by one-third, our estimate would be 11.7 percent.
Combining data across three cross-sectional data sources yields some inconsistency in time periods studied. Our target population is the wealthiest in each year of the period examined based on end-of-year wealth. The Forbes 400 data are released each fall. The 0.63 adjustment factor is based on families ranked by income in year t, compared to families ranked by wealth when surveyed at some point in year t+1 (though the reported wealth may or may not be current as of the time they were surveyed). Since the wealthiest families change over time, subtracting Forbes 400 totals across years understates the income of the wealthiest at the end of each year, which leads to overestimated tax rates.[13]
Our tax rate estimates are substantially lower than commonly cited top Federal individual income tax rates produced by the Congressional Budget Office, Joint Committee on Taxation, the Department of the Treasury, and the Tax Policy Center.[14] These estimates differ from ours in three key respects. First, and most fundamentally, the Congressional Budget Office, Joint Committee on Taxation, the Treasury, and the Tax Policy Center estimate tax rates relative to income measures that largely exclude unrealized capital gains. The analyses thus find substantially higher tax rates than we do because they, to varying degrees, exclude the untaxed income that motivates this analysis in favor of more accurately estimated cash income flows. Second, tax-preferred realized capital gains are a larger share of income for the top 400 than they are for the larger top groups for which these other estimates are produced. Third, we examine income tax rates by wealth rather than by income, and unrealized capital gains may be even more concentrated among high-wealth families than high-income families.
We conclude this technical appendix by emphasizing the fundamental uncertainty in our estimates. We hope that our analysis stimulates further estimation and direct measurement of income tax rates inclusive of unrealized capital gains income and by wealth group.
References
Bricker, J., P. Hansen, and A.H. Volz. 2019. "Wealth concentration in the U.S. after augmenting the upper tail of the survey of consumer finances." Economics Letters 184. (Link)
Cohen, Patricia. 2016. "Buffett Calls Trump's Bluff and Releases His Tax Data." New York Times, October 10. (Link)
Congressional Budget Office. 2021. "The Distribution of Household Income, 2018." (Link)
Johnson, B., B. Raub, and J. Newcomb. "A New Look at the Income-Wealth Connection for America's Wealthiest Decedents." SOI Working Paper. Washington: Internal Revenue Service Statistics of Income. (Link)
Joint Committee on Taxation. 2012. "Overview Of The Definition Of Income Used By The Staff Of The Joint Committee on Taxation In Distribution Analyses." JCX-15-12. (Link)
Joint Committee on Taxation. 2021. "Overview Of The Federal Tax System As In Effect For 2021." JCX-18-21. (Link)
Kennickell, A.B. 2009. "Ponds and Streams: Wealth and Income in the U.S., 1989 to 2007." Finance and Economics Discussion Series 2009-13. Washington: Board of Governors of the Federal Reserve System. (Link)
Kopczuk, W. 2015. "What Do We Know about the Evolution of Top Wealth Shares in the United States?" Journal of Economic Perspectives 29, no. 1: 47-66. (Link)
Piketty, T. 2014. Capital in the Twenty-First Century. Cambridge: Harvard University Press.
Saez. E. and G. Zucman. 2016. "Wealth Inequality in the United States since 1913: Evidence from Capitalized Income Tax Data." The Quarterly Journal of Economics 131, no. 2: 519-578. (Link)
Saez, E. and G. Zucman. 2019. "Progressive Wealth Taxation." Brookings Papers on Economic Activity Conference Draft. (Link)
Smith, M., O. Zidar, and E. Zwick. 2020. "Top Wealth in America: New Estimates and Implications for Taxing the Rich." Working paper, Princeton Economics. (Link)
Tax Policy Center. 2021. "T21-0134 – Average Effective Federal Tax Rates – All Tax Unites, By Expanded Cash Income Income Percentile, 2021." (Link)
U.S. Department of the Treasury Office of Tax Analysis. 2020. "Distribution Table: 2021 001; Distribution of Families, Cash Income, and Federal Taxes under 2021 Current Law." (Link)
[1] A wage earner may defer taxation—subject to statutory limits—by contributing to a retirement savings account. Other generally applicable tax benefits may also reduce a worker's tax rate.
[2] The minority of capital gains, realized within one year of acquiring the underlying asset, is taxed at ordinary rates.
[3] Unrealized capital gains are the increase in the value of assets even before the assets are sold. A wealthy individual who purchases corporate stock worth $100 million that subsequently increases in value to $200 million over the next ten years has accrued $100 million of unrealized capital gains income over that period. These unrealized capital gains are a major source of income for the wealthiest Americans.
[4] For example, the Federal Reserve's Distributional Financial Accounts estimate that, as of the first quarter of 2021, the top 1 percent of families by wealth held 54 percent of the value of corporate stocks and mutual funds, compared to 11 percent for 50th–90th percentiles, and less than 1 percent for the bottom 50 percent.
[5] For example, the Joint Committee on Taxation (2012) states, "Economists generally agree that, in theory, a Haig-Simons measure of income is the best measure of economic well-being."
[6] This approach would be less informative for middle-class families because they consume a much larger share of their income.
[7] We lack direct evidence on the average tax rate paid by the highest-wealth families. In principle, the average tax rate could differ in either direction. The highest-income families could pay a lower average tax rate because they are high-income due to large single-year capital gains realizations that are taxed at low rates. Alternatively, the highest-wealth families could pay a lower share of their tax-return income in taxes due to large charitable deductions.
[8] The Survey of Consumer Finances intentionally excludes from its sample anybody included in the Forbes 400 due to privacy concerns. However, some Forbes 400 wealth may be represented by families included in the Survey of Consumer Finances sample, and some additional observations are also excluded from the SCF sample. Bricker, Hansen, and Volz (2019) propose a method for augmenting the SCF with the Forbes 400 data without double counting. We simplify by assuming that there is a sharp cutoff between the two and do not rely on the Survey of Consumer Finances to compute any aggregates.
[9] Note, however, that the assumption of full overlap would imply that the desired ratio for the top 400 would be one. In effect, under this set of assumptions, the value for the next 1000 would be a poor guide to the value for the top 400. In implementing the procedures described in this section, we use the 2001-2019 SCFs and average the resulting annual adjustment factors across years in order to increase our effective sample size.
[10] Technically, because the SCF is a survey with sample weights, we mean the observations that, when weighted, represent these ranks. We split SCF observations that cross relevant rank boundaries, allocating a proportionate share of the observation's weight to each side of the boundary.
[11] The date for which the Forbes 400 estimates wealth has varied over time. In 2020, Forbes used market prices near the end of July. In 2019, Forbes used market prices in September. For simplicity, we treat the Forbes 400 as end-of-year wealth estimates. The Forbes list is a mix of person-level information and immediate-family information. By treating it as family-level (more precisely, tax-unit-level) information, our estimate of income could potentially be somewhat conservative, though we anticipate this effect is small.
[12] We impute the State and local tax deductions for the top 400 for the period 2015–2018 as the top 400's share of the top 0.001 percent's State and local tax deductions in 2014 multiplied by the total deductions of the top 0.001 percent for 2015–2018. The 2017 tax law limited the State and local tax deduction. For 2018 only, we impute total State and local tax deductions of the top 0.001% tax units by multiplying 2018 top 0.001% Federal taxes by the ratio of total 2014-2017 State and local tax deductions to total 2014-2017 top 0.001% Federal taxes.
[13] A further timing issue that could arise is if the wealthy systematically realize capital gains only when they are not in the top 400 by wealth. In this case, the tax rate of the top 400 by wealth in each year could understate a life-cycle estimate of the tax rate of the extremely wealthy. However, it is not clear that—if this is a concern—our estimate of the tax rate of the extremely wealthy is affected by it. If it were the case that the extremely wealthy systematically do not realize their income when they are in the top 400 by wealth, our adjustment factor may be an overestimate of their taxable income.
[14] The Congressional Budget Office (2021) recently estimated that the average Federal individual income tax rate of the highest-income 1 percent of households was about 24 percent for the period 2014 through 2018. Other analysts focus primarily on forward-looking estimates. The Treasury Department (2020) estimated that the average Federal individual income tax rate of the highest-income 0.1 percent of families in 2021 would be 23 percent, and the Tax Policy Center (2021) estimated that it would be 25 percent. The Joint Committee on Taxation (2021) estimated that the tax rate for families with incomes of at least $1 million would be 26 percent. The 2017 Tax Act reduced individual income tax rates in 2018. However, this effect is small relative to the difference between the average Federal individual income tax rate on the wealthiest that we estimate and the estimates cited here.

0 件のコメント:
コメントを投稿